
Fast setup, no cleanup
Upload files, connect accounts, or paste a URL—the platform recognizes instruments, FX, splits, and corporate actions. Skip spreadsheets and step into true investment portfolio management and analysis software.


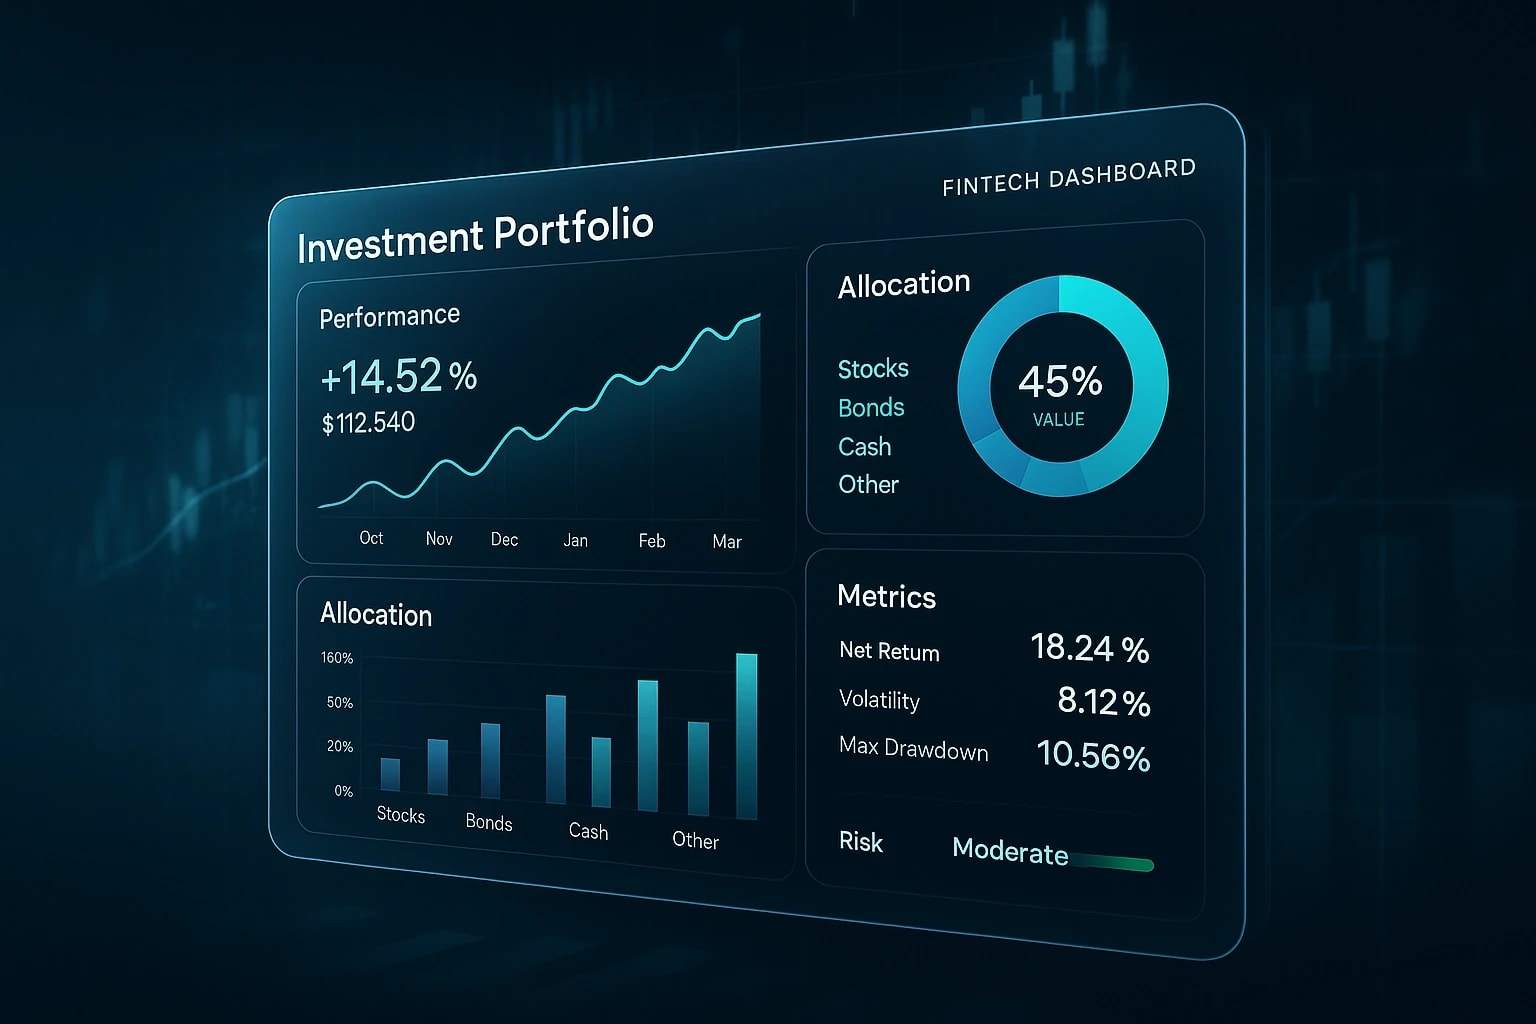
Upload CSV/Excel, connect a broker, or paste a portfolio URL. Then track, measure, and analyze performance at custom intervals—at a glance.
Simply upload a CSV or Excel file, connect a broker account, or paste a public portfolio URL. The tool automatically identifies your holdings, asset classes, sectors, and currencies—no manual setup needed.
With one click, get a clear overview of allocation, risk, and performance. See your returns, volatility, and diversification instantly, along with key ratios like Sharpe, Sortino, and drawdown. The analyzer also highlights your factor exposure (value, growth, quality, size, momentum) and ESG profile for deeper insight.
Our AI turns complex data into simple, actionable insights. You’ll see benchmark comparisons, fee and tax impact, and any risk or drift alerts—all in one dashboard. Easily export results to Excel or PDF, or explore what-if scenarios to test your portfolio under different market conditions.
Upload files, connect accounts, or paste a URL—the platform recognizes instruments, FX, splits, and corporate actions. Skip spreadsheets and step into true investment portfolio management and analysis software.

Built for multi-asset portfolios (equities, ETFs, funds, bonds, options, crypto, alts). Pulls key facts from holdings, transactions, and cash; adds traceable citations back to lots for quick verification.
-1.png&w=3840&q=90)
See allocation by asset/sector/region, concentration heatmaps, and factor tilts with a click.

Readable summaries that explain performance drivers, style drift, and risk hot spots—in plain language for PM reviews and client updates.

Spot portfolio drift vs. policy targets; propose tax-aware portfolio rebalancing with tolerance bands, wash-sale awareness, and transaction cost estimates.

Multi-level attribution (allocation vs. selection vs. interaction), factor attribution, fee drag analysis, and realized/unrealized tax impact—fully auditable.
Roll up multi-account performance, risk, and liquidity; compare to policy/benchmarks; and surface factor exposure, drawdown, and variance. Export board-ready pages with attribution (allocation vs. selection), drift alerts, and clear benchmark comparisons in minutes.
![[object Object]](/_next/image?url=%2Fapi%2Fmedia%2Ffile%2Ftracker.png&w=3840&q=90)
![[object Object]](/_next/image?url=%2Fapi%2Fmedia%2Ffile%2Ftracker_detail.png&w=3840&q=90)
Assess suitability and diversification, compute after-tax returns, and propose tax-aware rebalancing within tolerance bands. Produce client-ready reports with ESG exposure, fees/fee-drag, and plain-English insights so clients see what changed, why it matters, and recommended fixes.
Standardize models and sleeves, monitor risk limits (volatility, beta, VaR/CVaR), and track concentration and style drift. Automate rebalance proposals, run what-if scenarios, and export audit-ready heatmaps and limit-breach alerts for faster PM reviews and compliance workflows.


Investment portfolio analyzer for allocation, risk, performance, factor exposure, and tax-aware rebalancing—clear summaries, explainable attribution, drift alerts, and what-if scenarios.